Motivation
Automating the operation enables repetitive processes, good practices, and the collection of data for business intelligence and data mining.
The application started as a Google Sheets file. In its current form, it allows for the management of multiple vehicles, providing statistical insights and visualizations.
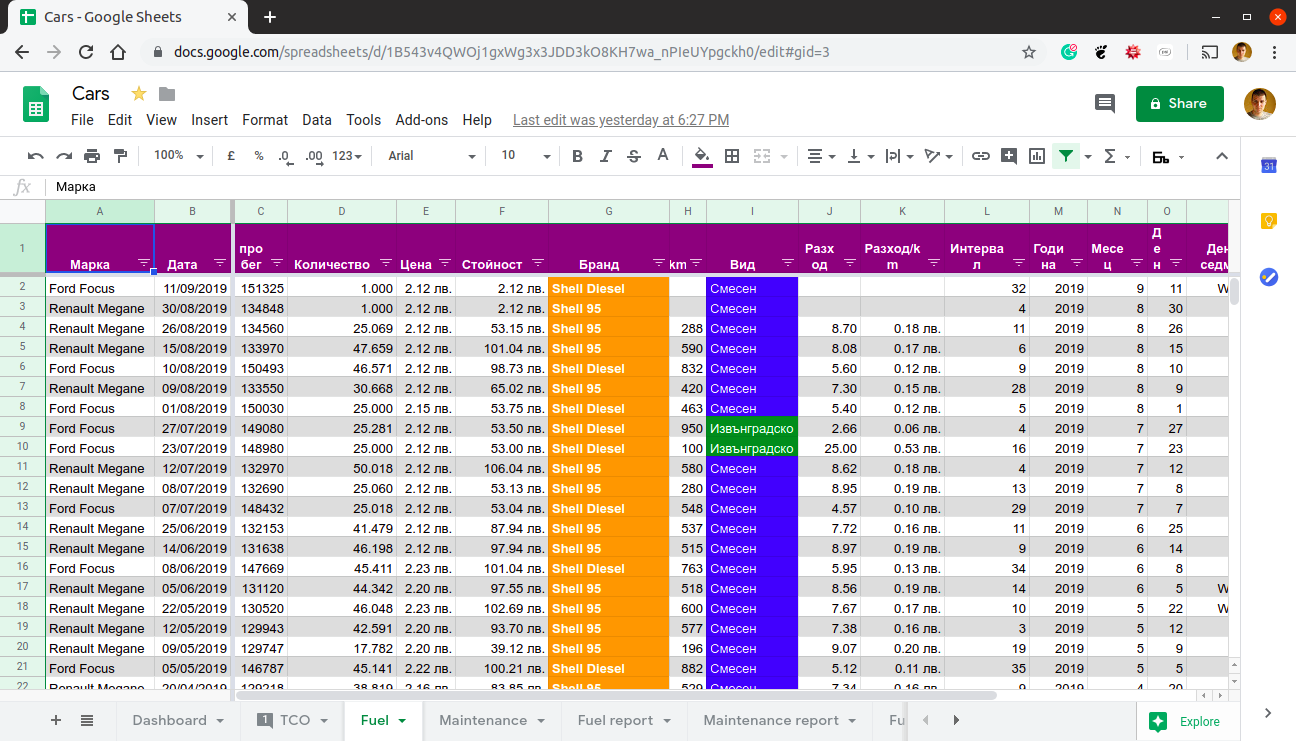
Refueling log
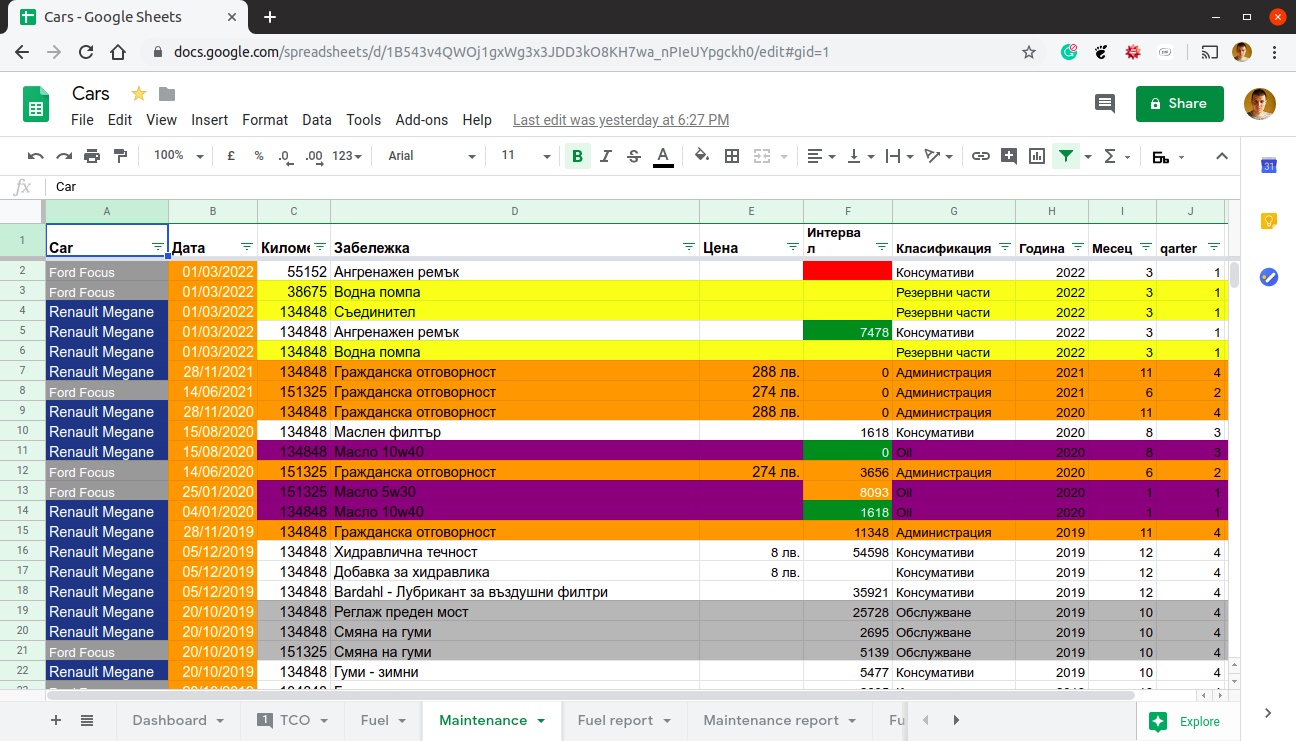
Maintenance log
As interest in the product increased, I realized that platform shortcomings were limiting usability. Each new customer required a separate version of the application, and aggregating information from multiple files created overhead.
Although Google Sheets is available in a mobile version, the experience differs significantly from the desktop version.
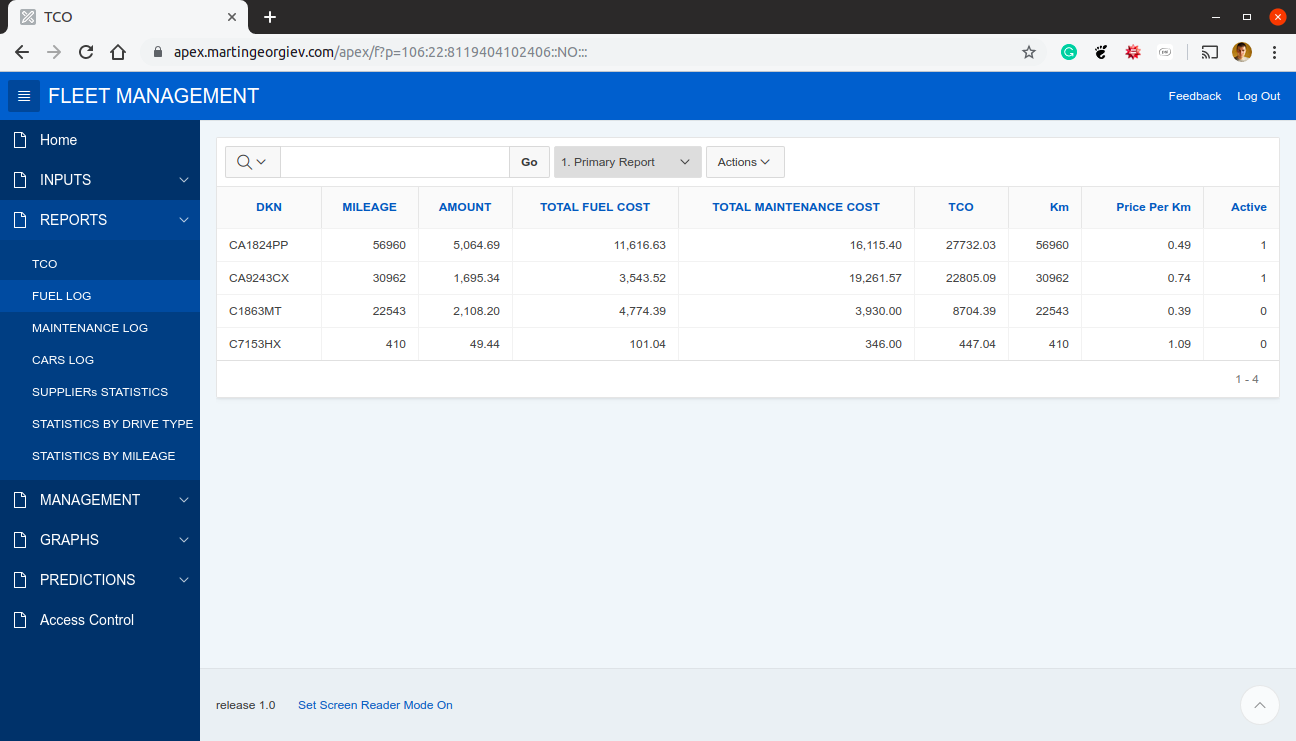 The report shows the mileage, fuel amount consumed, fuel and maintenance cost, and the total cost of ownership (TCO), TCO per kilometer per each car in the fleet.
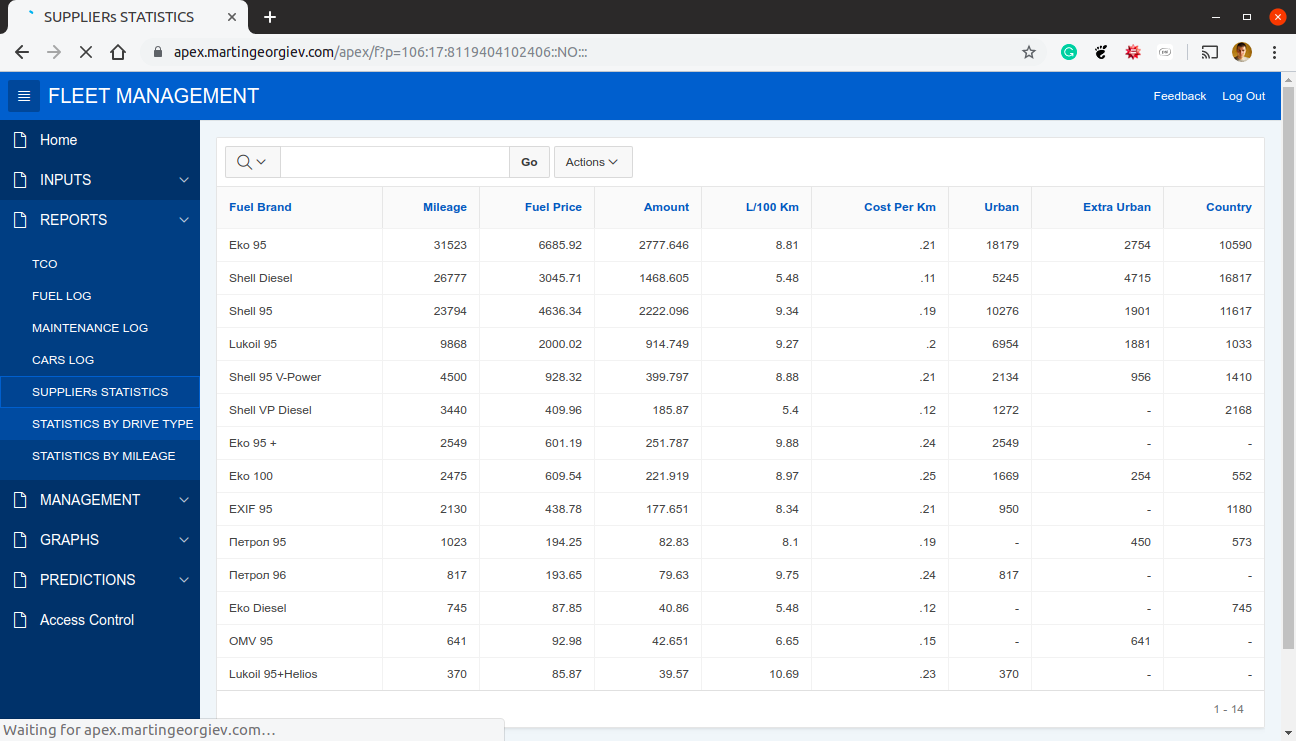
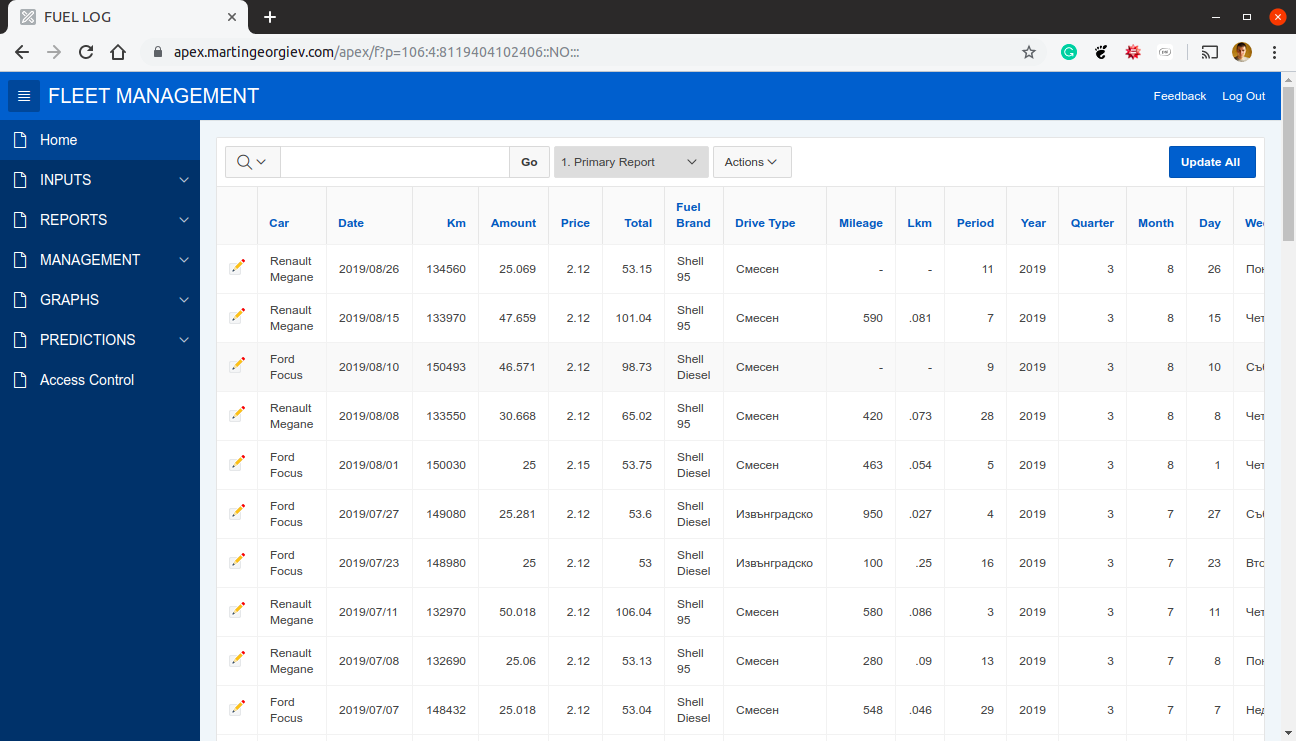 Log of all refueling events. Enrich them with categorical attributes to enable filtering by vehicle, date attributes, periods between events.
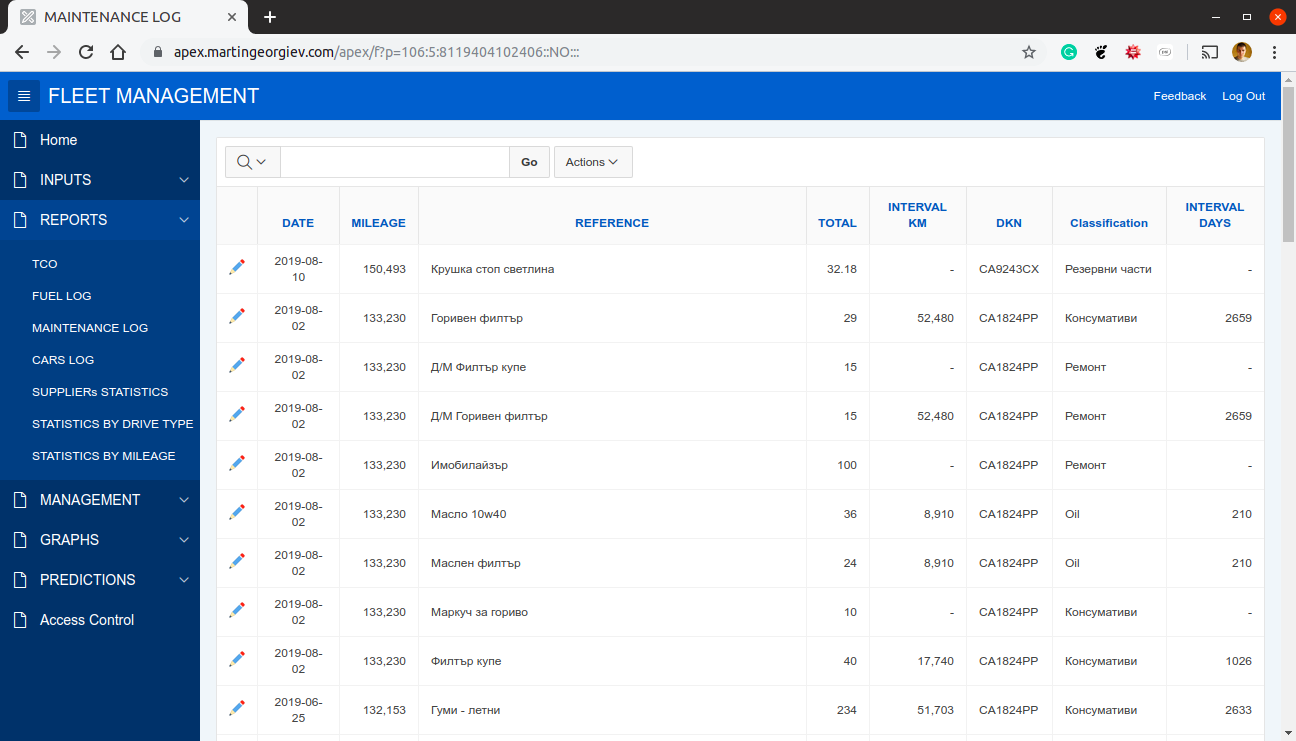 Log of all maintenance events enriched with periods (date and mileage). Enable filtering by vehicle, date attributes, type, and periods between events.
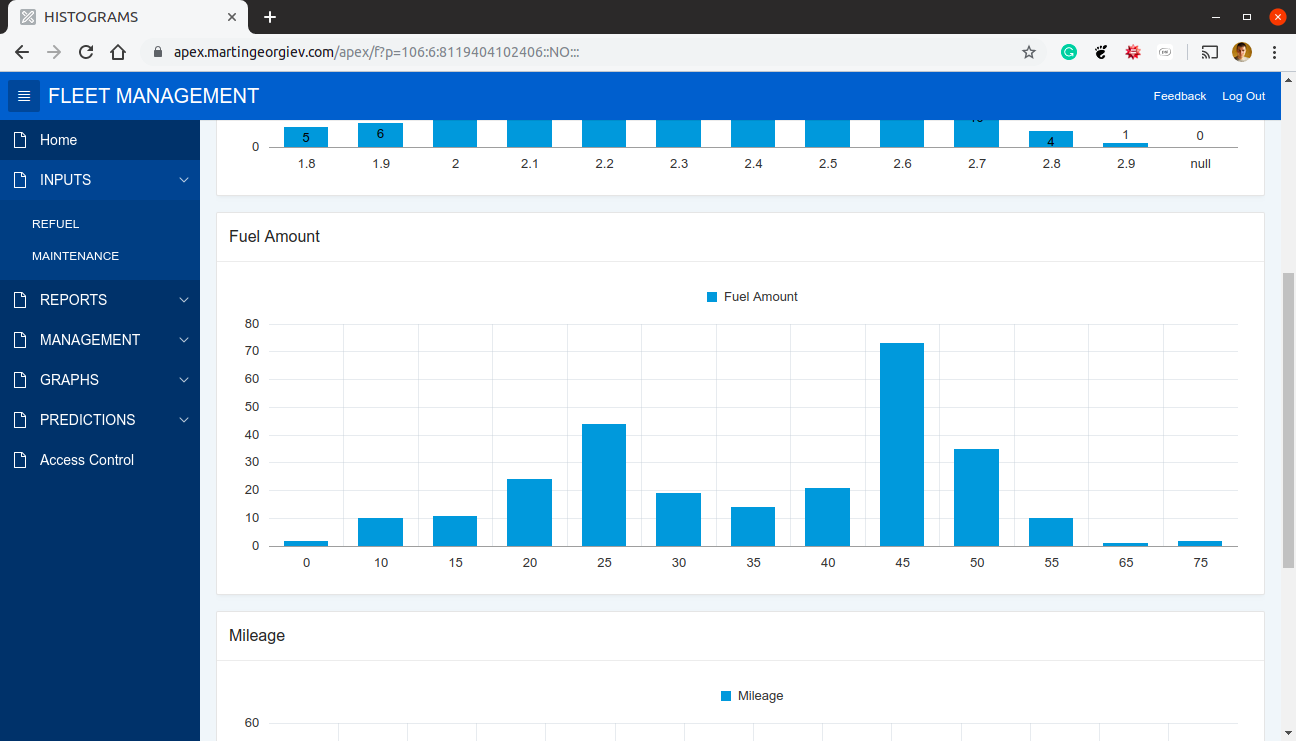 Histograms to illustrate the frequency of distribution for Fuel price, Fuel Amount, and Mileage.
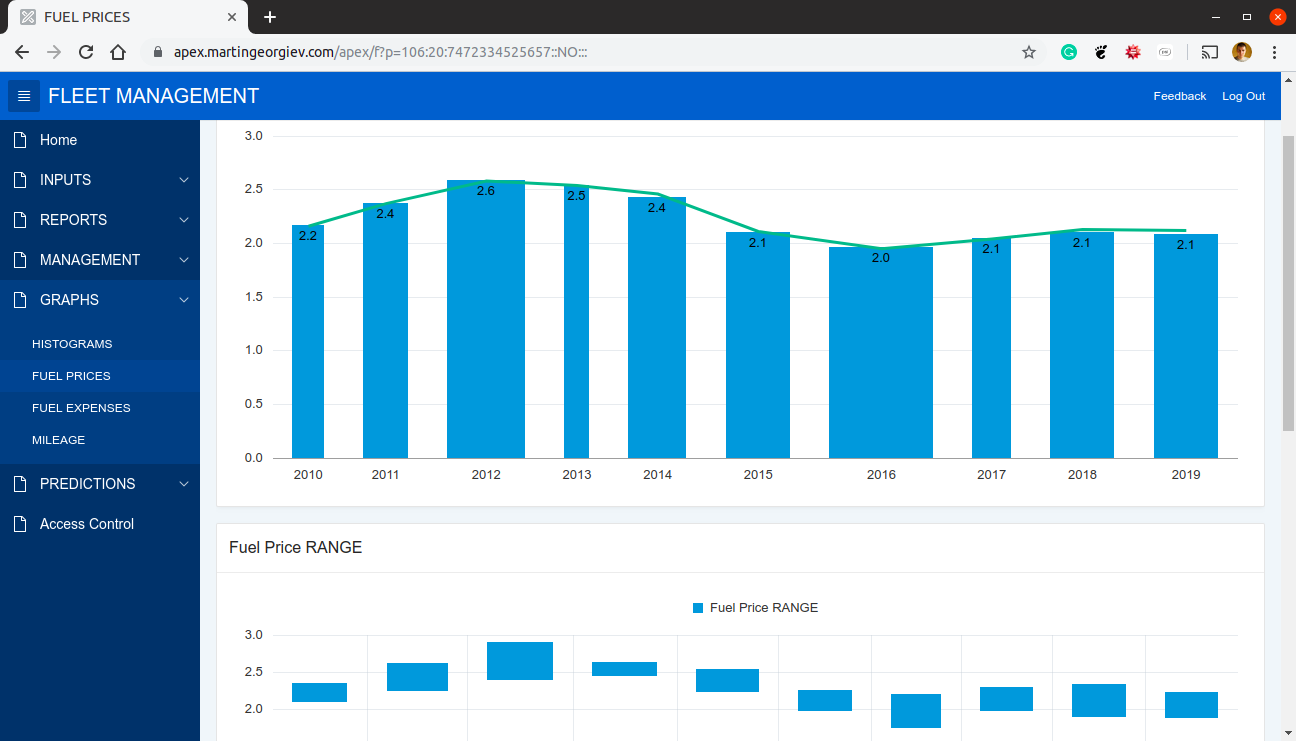 Fuel price, range, min/max, and average.
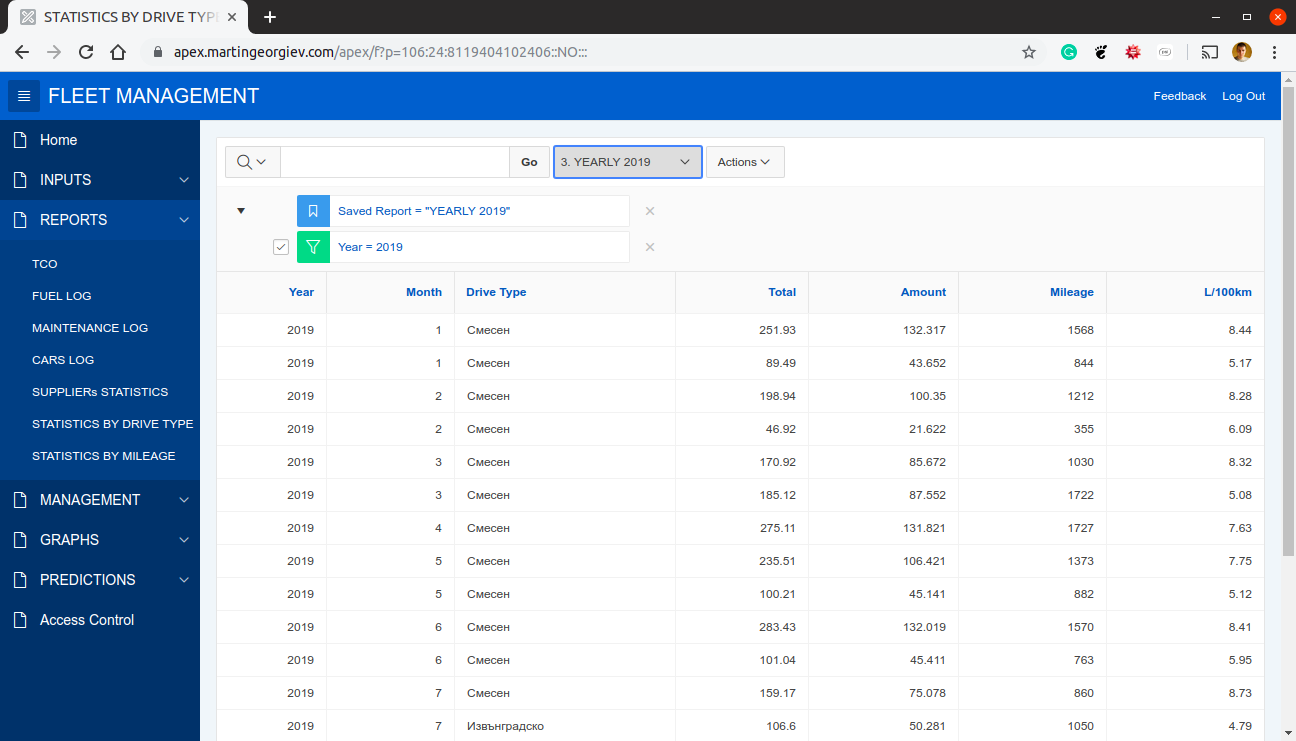
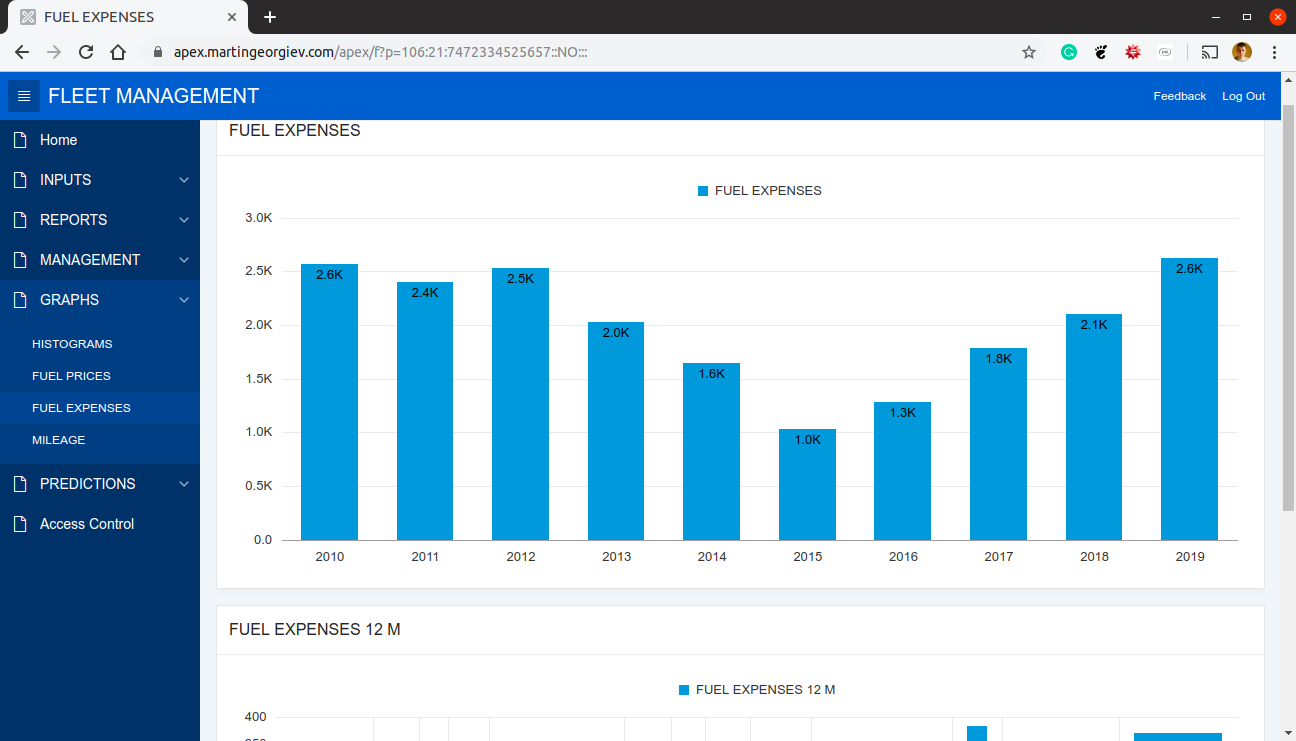 Comparison of expenses per year, for the last 12 months, including range.
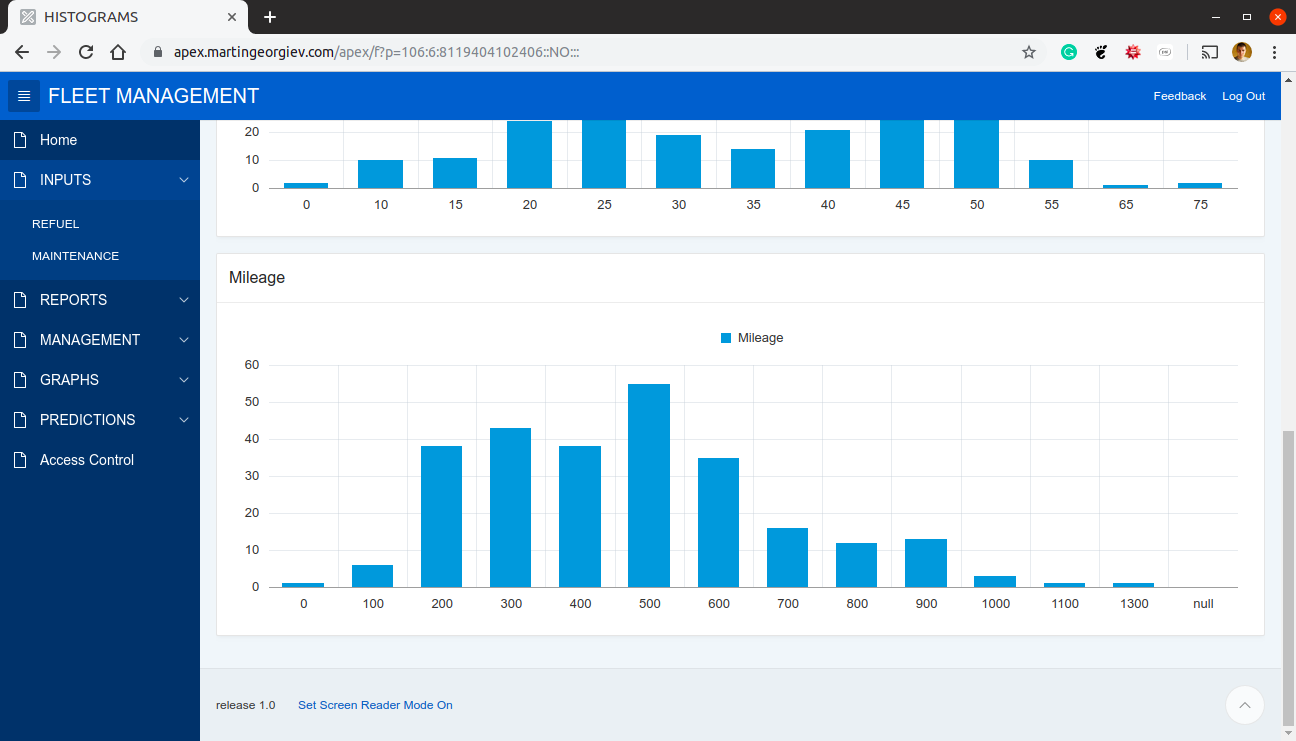 Various comparisons for mileage per months (consequtive), quarter, and year inclding standard deviation.
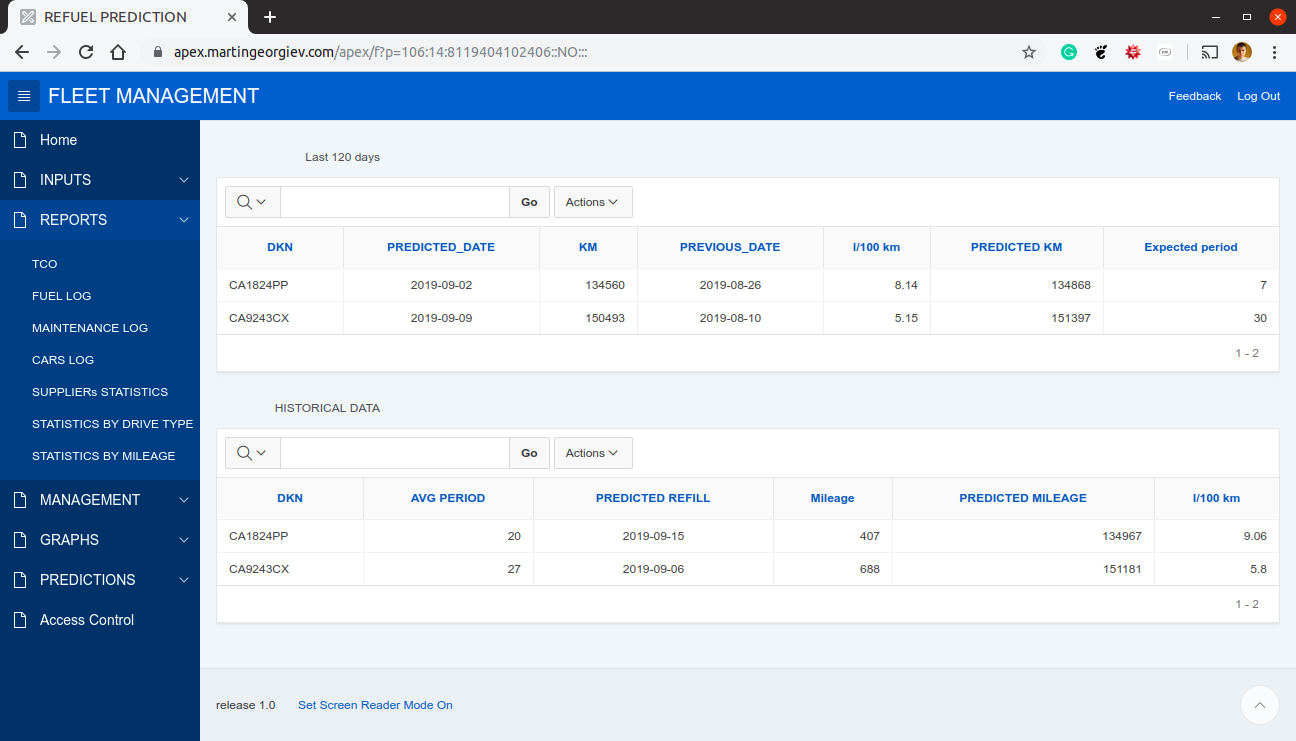 Uses historical data to predict next refueling date, and expected mileage reading based on all records or a subset of the last 12 months.
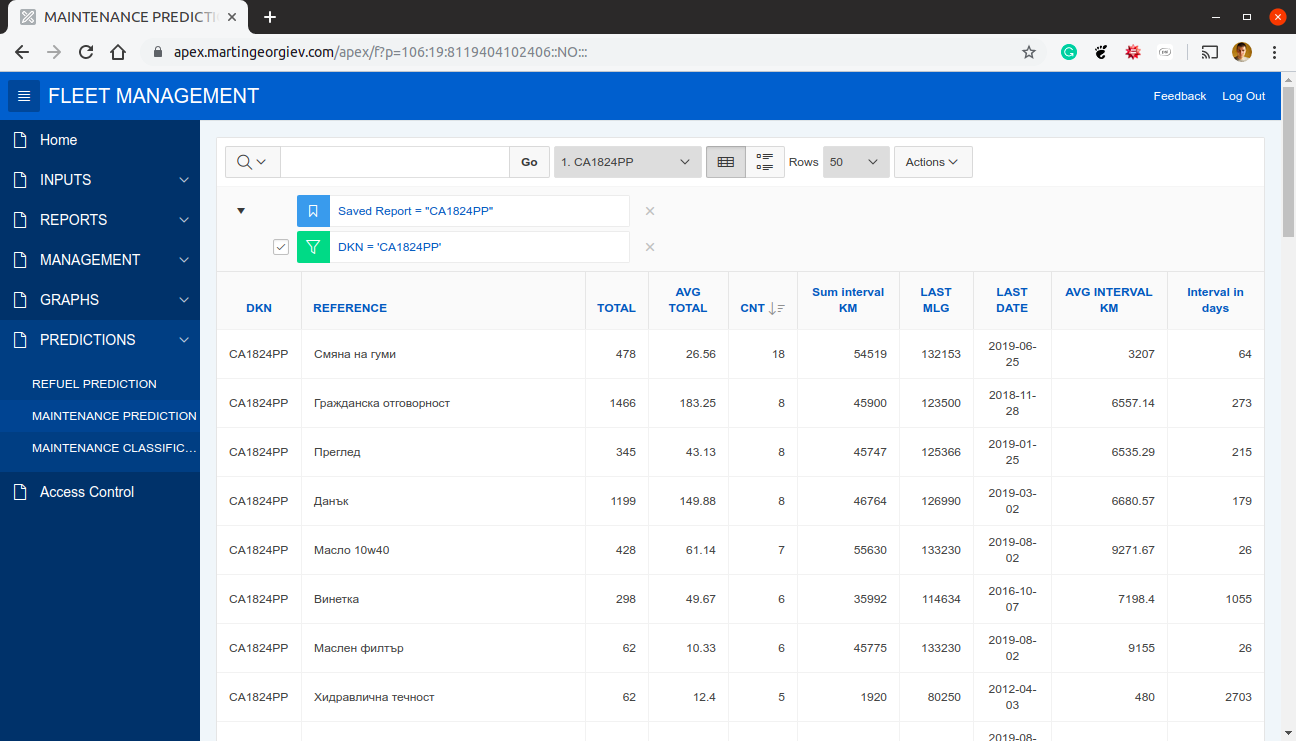 Predicts the next maintenance execution based on the averages for the particular item. The results are sorted by frequency of occurrences.